Lead Particulates
Under the Microscope
See what lead contamination actually looks like at the microscopic level — and understand why the CDC says there is no safe level of lead exposure.
Revealing the Invisible Threat
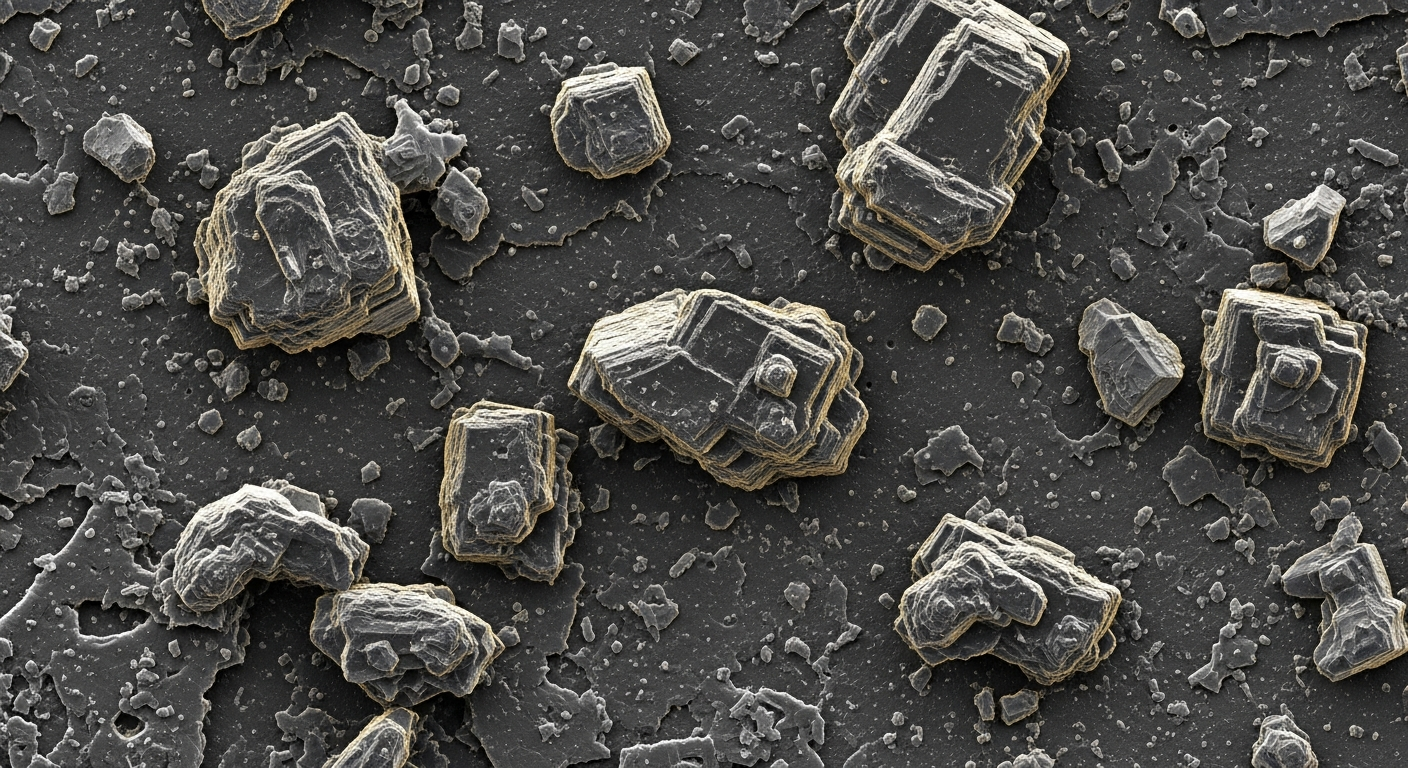
Lead in drinking water is invisible to the naked eye. You can't taste it, smell it, or see it — but under a scanning electron microscope (SEM), lead particulates reveal their true nature: crystalline structures that break free from aging pipes and enter your body with every glass of water.
The image shows lead carbonate crystals (cerussite) at high magnification. These orthorhombic crystals form inside lead pipes as a protective scale — but when water chemistry changes, they dissolve and release lead particles directly into your drinking water.
Microscopy Video: Lead Particulates
Scanning electron microscopy footage showing lead particulate structures at various magnifications. These crystalline formations are what break free from aging lead pipes into your drinking water.
What Different Magnifications Reveal
From visible sediment to atomic-level analysis, each magnification level reveals different characteristics of lead contamination in your water.
Visible Sediment
100x MagnificationAt 100x magnification, lead particulates appear as irregular dark specks among pipe scale and sediment. Particles at this scale (>100 μm) are often visible as cloudy water or sediment after stagnation.
Crystalline Structures
1,000x MagnificationAt 1,000x, lead particles reveal distinct crystalline structures — lead carbonates (cerussite) and lead oxides (litharge). These form protective scales inside pipes that can dissolve when water chemistry changes.
Nanoparticulate Lead
10,000x MagnificationAt 10,000x magnification, scanning electron microscopy reveals nanoparticulate lead — particles smaller than 1 μm that pass through standard filters and are more bioavailable than dissolved lead.
Atomic-Level Analysis
50,000x MagnificationAt extreme magnification with SEM-EDS, individual lead crystal faces and elemental composition become clear. Energy-dispersive X-ray spectroscopy confirms the precise elemental makeup of each particle.
Where Lead Enters Your Water
Lead contamination can originate from multiple points between the water main and your faucet. Understanding the source is key to choosing the right solution.
Lead Service Lines
Pure lead pipes connecting water mains to homes. Built before 1986, these lines are the largest source of lead in drinking water. The EPA's 2024 Lead and Copper Rule Improvements require replacement within 10 years.
Lead Solder Joints
Lead-tin solder was used to join copper pipes until banned in 1986. Even small amounts of lead solder can leach into water, especially with acidic or soft water that corrodes the solder joints.
Brass Fixtures & Valves
Brass faucets, valves, and fittings historically contained up to 8% lead by weight. The 2014 Reduction of Lead in Drinking Water Act reduced this to 0.25%, but older fixtures remain in millions of homes.
Galvanized Steel Pipes
Galvanized iron pipes downstream of lead service lines accumulate lead deposits over decades. Even after lead pipes are replaced, these galvanized sections continue releasing stored lead particles.
Health Effects of Lead Exposure
The CDC states there is no safe level of lead exposure. Even low-level chronic exposure causes irreversible harm, particularly in children and pregnant women.
Neurological Damage in Children
2-5 IQ point reduction per 5 μg/dL blood lead
- Irreversible cognitive impairment even at low levels
- Behavioral disorders including ADHD and aggression
- Reduced academic performance and earning potential
- CDC: No safe blood lead level has been identified for children
Cardiovascular Effects
Associated with 412,000 premature deaths/year in the U.S.
- Hypertension and increased blood pressure
- Increased risk of coronary heart disease
- Lead accumulates in bone and releases over decades
- EPA estimates $84B annual economic impact
Kidney & Organ Damage
Nephrotoxic at blood lead levels >10 μg/dL
- Chronic kidney disease and reduced GFR
- Proximal tubular damage disrupts mineral absorption
- Reproductive toxicity in both males and females
- Increased risk of gout from lead-impaired uric acid excretion
Infant & Prenatal Risk
Infants absorb 40-50% of ingested lead vs. 3-10% in adults
- Lead crosses the placental barrier affecting fetal development
- Associated with preterm birth and low birth weight
- Formula prepared with lead-contaminated water multiplies exposure
- Developing blood-brain barrier offers less protection
How Our Lab Identifies Lead
We use EPA Method 200.8 (ICP-MS) — the gold standard for trace metals analysis — along with advanced microscopy to detect and characterize lead in your water down to 0.1 parts per billion.
ICP-MS Analysis
Inductively Coupled Plasma Mass Spectrometry — the gold standard for trace metal detection. Atomizes your water sample in 6,000°C plasma, then separates and counts individual lead isotopes. Detection limit: 0.1 ppb.
Scanning Electron Microscopy
Captures high-resolution images of particulates and identifies their elemental composition using energy-dispersive X-ray spectroscopy. Reveals whether lead comes from pipes, solder, or fixtures.
Stagnation Sampling
Water that has sat in pipes for 6+ hours (overnight) contains the highest lead concentrations. Our kit includes first-draw and flushed-sample containers to measure both worst-case and typical exposure.
Source Identification
By collecting multiple sequential liters, we can pinpoint where lead enters your water — service line, interior plumbing, or fixtures — based on concentration profiles across the draw sequence.
What Your $99 Test Reveals About Lead
Our comprehensive water test measures total lead concentration using EPA Method 200.8, with results compared against both the EPA action level (15 ppb) and the health-based goal (0 ppb). We analyze both first-draw and flushed samples to determine whether lead is coming from your service line or interior plumbing.
Explore More Water Science
Dive deeper into the contaminants and microscopy topics that affect your water quality.
Forever Chemicals (PFAS)
PFAS contamination in drinking water
Learn MoreMicroplastics in Water
Plastic particles in your tap water
Learn MoreUnregulated Wells
Private well water risks
Learn MoreAging Pipes
How old infrastructure contaminates water
Learn MoreMicroplastic Fibers
Synthetic fibers under the microscope
Learn MoreColiform Bacteria
Bacterial contamination in water
Learn More